How to set up Google Analytics
Google Analytics is a must-have analytics tool to gain insights into your website traffic and how the users interact with your website.
Having a website is not enough to create value for your business. You need to understand who your visitors are, how they interact with your website and how he is responding to your website.
This is where Google Analytics comes into play!
Google Analytics is a FREE and POWERFUL tool that is used by more than 53% of websites. To use it, you must set it up correctly. There are multiple ways to install Google Analytics on your website.
Install Google Analytics using any one of the methods mentioned below -
Method 1 – Use a Google account to set up analytics
1. Log in to your Google Analytics account using the Google Account credentials. If you don’t have a Google account, you can create a new account and use it to log in to Google Analytics
2. Click Admin on the left-hand side of the screen and select the Account from the left-column
3. Select the property from the middle column titles property
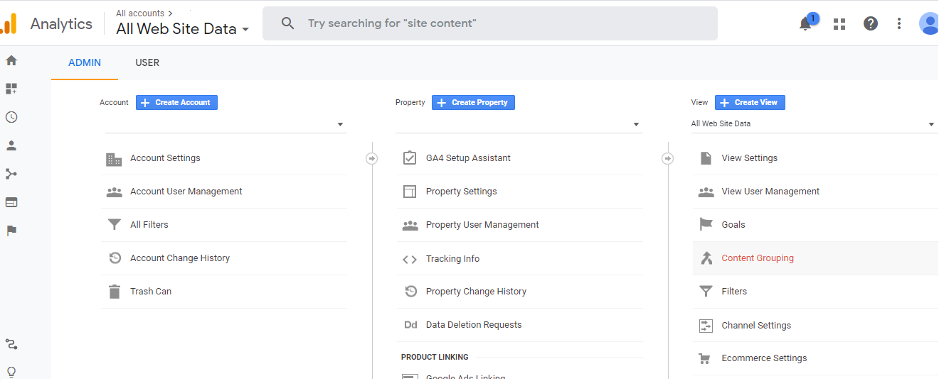
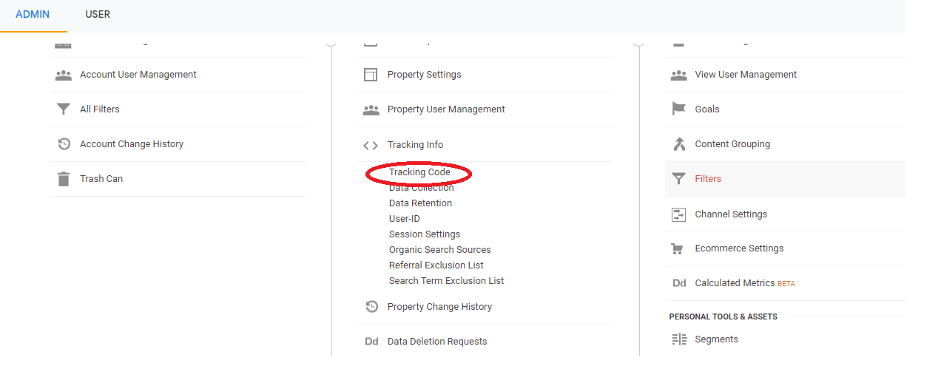
4. Use the property column and click on ‘Tracking Code’ from the ‘Tracking Info’
5. Your website’s unique tracking ID is shown at the top of the page.
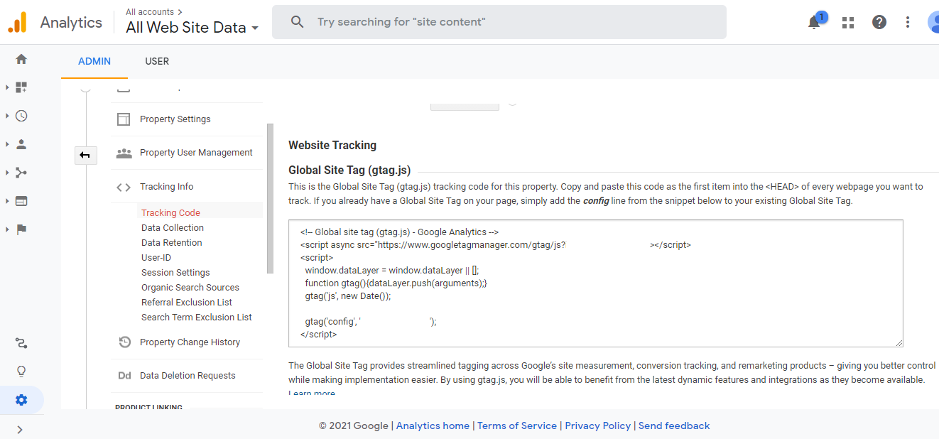
6. Copy the tracking snippet and paste it in every page of your website or header/footer of your website
Method 2 – Configure Google Tag Manager with Analytics
You can use Google Tag Manager to add install Analytics code to your website. It takes all the data from your website and sends it to all the platforms such as Google Analytics, Facebook Analytics etc.
You can easily update the tags without writing multiple codes at the backend of the website. Without Google Tag Manager, you will have to manually change all the links.
- To create Google Tag Manager Account, go to https://www.google.com/analytics/tag-manager/ and sign up for FREE.
- Follow up the instructions on the screen to create your tag manager account
- Install the tracking code provided in the tag manager on your website.
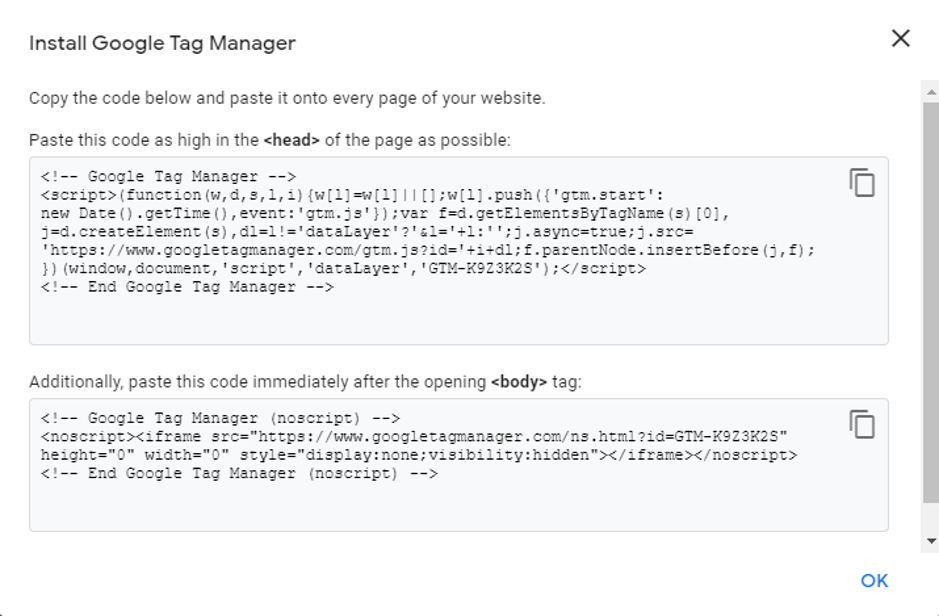
Refer to the above tracking code example
- You need to place the two snippets of code on each page of your website. You can even add the code in the header/footer of your website.
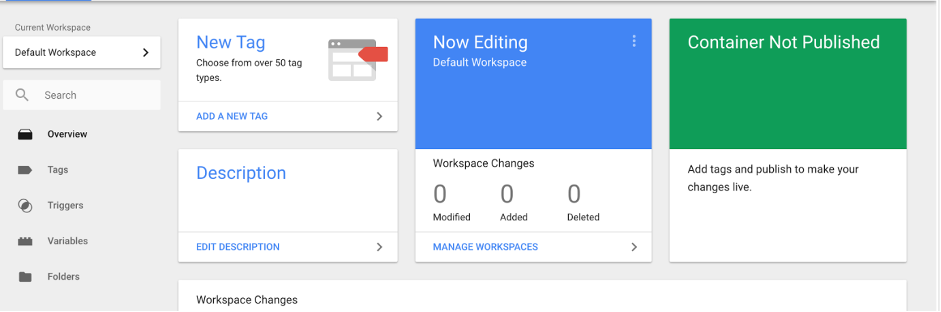
- The next step is to set Google Analytics via the Tag Manager.
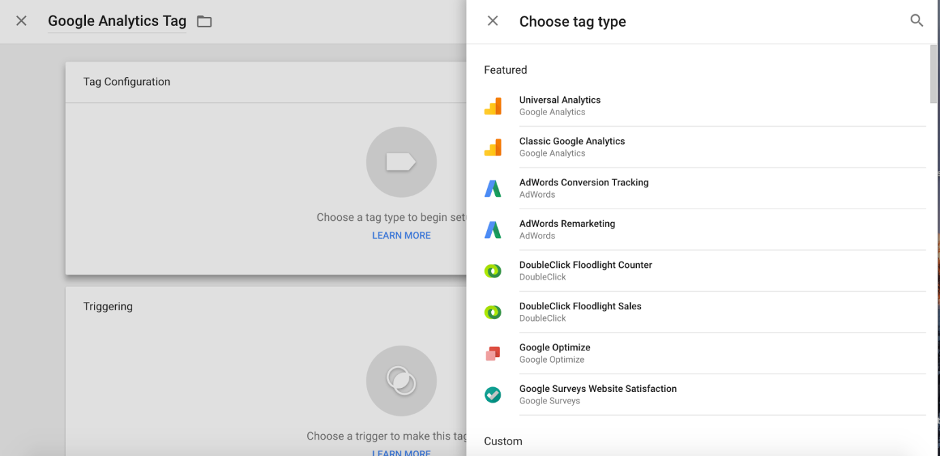
- Select Create Tag in Google Tag Manager and choose Google Analytics
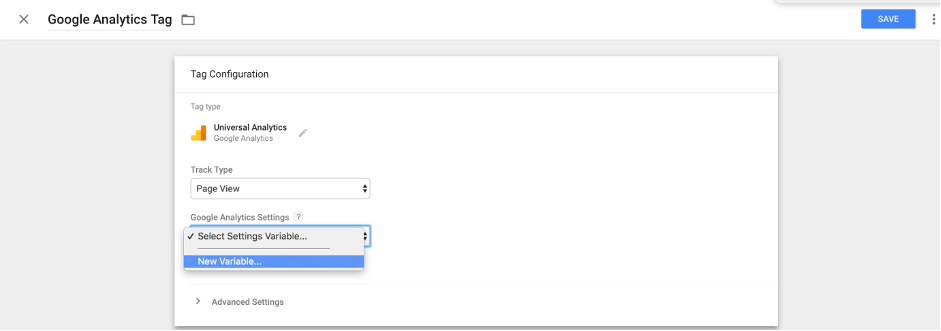
- Select Universal Analytics and name your tag – preferably something related to Google Analytics.
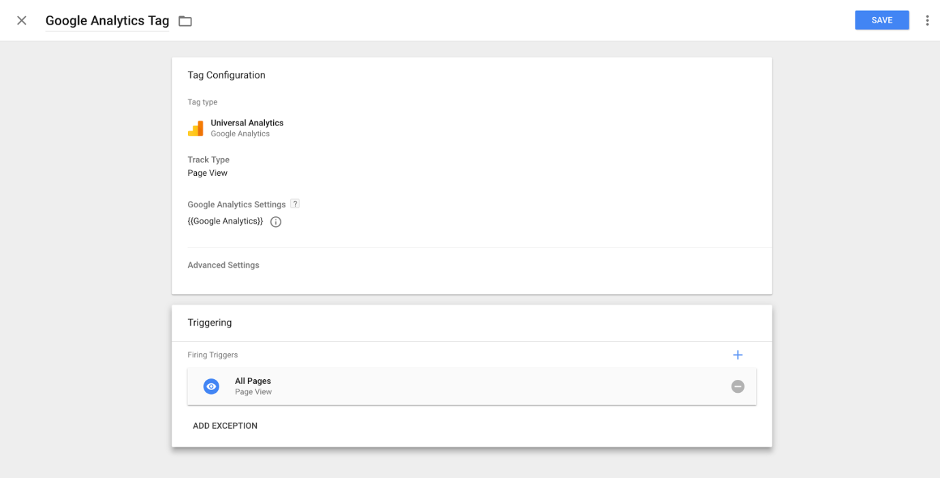
- Add the Google Analytics property and choose the track type
- Choose All Pages and ‘Submit’.
Congratulations! Your website is configured with Google Analytics.
You can add Google Analytics to your website using either of the methods explained above.
Start exploring the traffic on your website!!
Key Metrics on Google Analytics to track your website traffic
Once you have set up Google Analytics, the next step is to understand the key metrics to analyse your website traffic. Based on the performance of these metrics, you can understand the visitor’s actions and improve your website.
To get the most out of your Google Analytics account, here are the key metrics to focus on. You can optimize your website by using these metrics and improve your website.
Most of the key metrics are found in the ‘Audience’, ‘Acquisition’, ‘Behaviour’ and ‘Conversion’ section within the dashboard of Analytics.
Once you are aware of the important metrics, you will be able to make optimum use of Google Analytics to track the progress of your website.
Users & Sessions
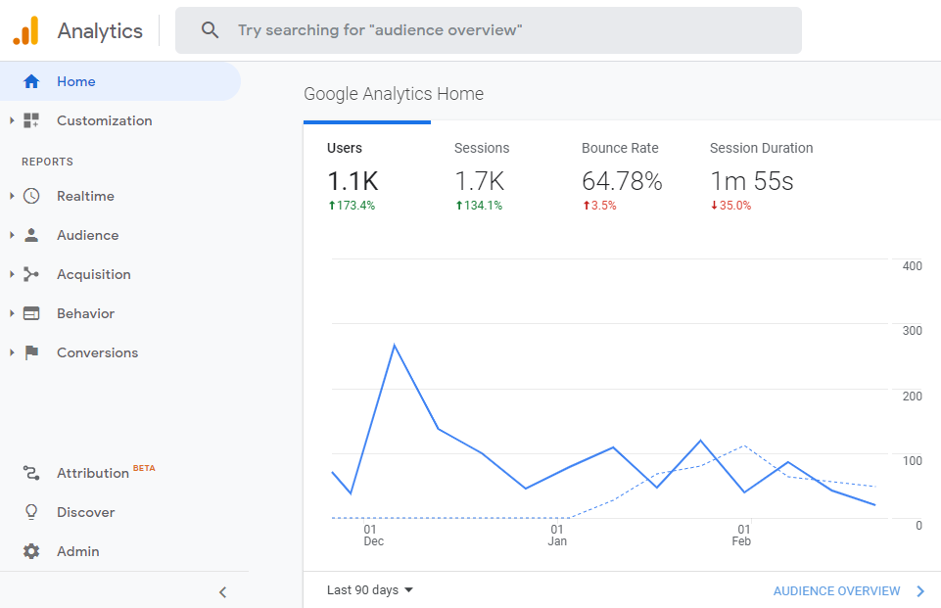
These are the two important KPIs that help you know about the number of visitors coming to your website. To make them take an action on your website, you need to understand their behaviour on your website.
The above screenshot has several users and sessions over some time. Here, the number of users is 1.1K and Sessions is 1.7K.
Initially, each visitor is referred to as a user. Until 2014, this metric was called “unique visitors”. Any time a new user lands on your website, Google assigns them a new ID – and is stored as a cookie in your browser.
Every page view or action tracked during this period makes “Session”. However, if the same user visits the website several hours later – a new session is counted.
In short, ‘Users’ are the unique visitors of the website – whereas “Sessions’ are how many times your website/webpage was being visited.
Bounce Rate
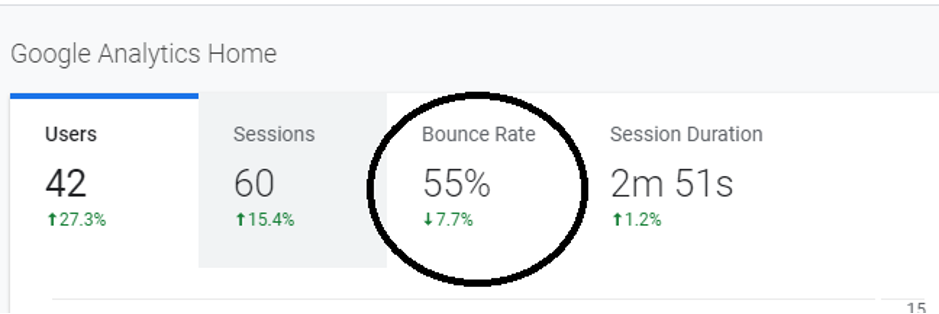
This is another important metric that describes the percentage of sessions in which a single page on the website was visited. This metric indicates whether the user finds the desired information on the website or not.
In other words, the bounce rate is the number of times a new visitor visits the website and leaves the site immediately without completing the tasks.
Having a high bounce rate is indicative of several things like – poor design, low-quality content, weak sources of traffic and so on.
As a rule of thumb, one should aim for the website bounce rate to be under 40%. Whereas, the bounce rate between 55%-65% indicates that you need to improve the page. If your bounce rate is above 90%, it often indicates a tracking error.
Sources for incoming traffic
The source in Analytics is the origin of traffic i.e. the place where your website traffic is coming from. 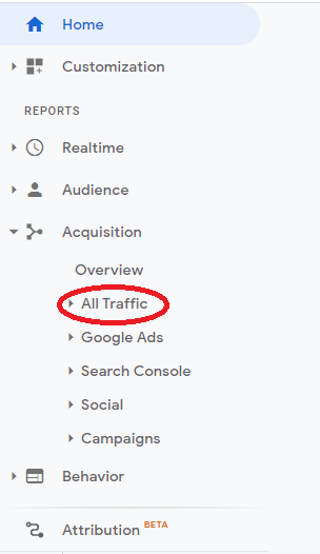
There can be different sources of incoming traffic such as – direct, search and referral. Each source of traffic can provide valuable insights into your website traffic.
The source is known as direct when it doesn’t come from any website. Similarly, if the visitor comes to your website from a social platform, then the source is called ‘Social’.
If the visitor comes to your website from any 3rd party website, it is known as ‘Referral’.
For instance – high volume referral traffic shows that your website or products/services are being talked about by 3rd party websites or social media sites.
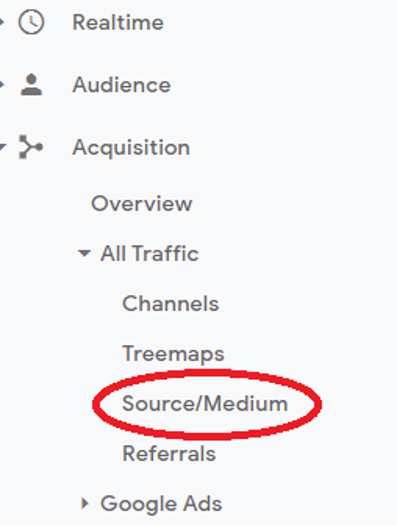
You can find the traffic sources from the ‘Acquisition’ tab and “All Traffic”. Select the Source/Medium from the tab.
Acquisition
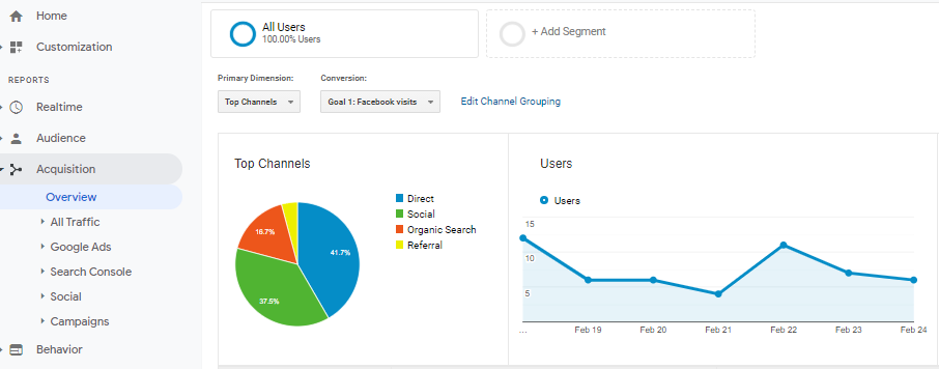
The Acquisition metric enables you to keep an eye on the traffic sources – direct, social, referral etc and compare them.
This metric contains details such as percentage of new sessions, number of sessions, average session, bounce rate etc.
In short, it provides a detailed view of traffic sources and how the users are engaging with your website.
You can also keep track of the conversions in the ‘Acquisition’ tab.
Goal Completion
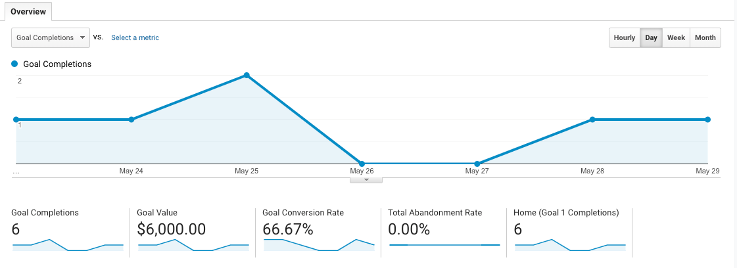
The “Goal Completion” metric in Google Analytics helps you understand the number of times a visitor completes a specific goal on your website.
As the owner of your website, you can pick any action you want to track and set up a goal. Even simple actions like – filling up the contact form can be a goal.
You can define the goals like - purchasing on the website, signups, visits to specific URL etc.
Create multiple goals and find the completion status by visiting the tab – Conversion > Goals > Overview.
Location
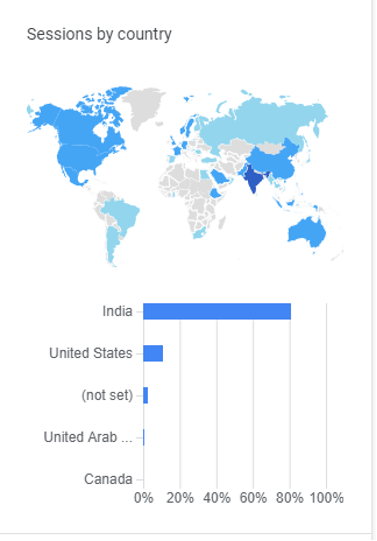
The location report in Google Analytics helps you understand where your visitors are located. By getting in-depth insights into visitor location – you will know where to improve your marketing services.
You can find the ‘Location’ details under ‘Demographics’ in the Audience section. The location of the visitor is tracked with the help of an IP address.
The data provided at the country level is pretty accurate. The location data helps you in targeting the particular market and help you understand who you are reaching.
Device Usage
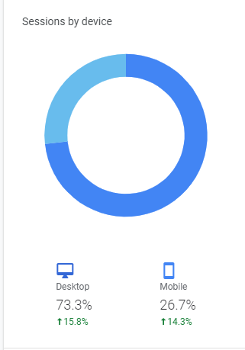
The metrics on Google Analytics go far beyond simply counting the amount of traffic to your website. The insights like ‘Device Overview’ help you know about the device used by the user to check your website.
In the ‘Audience’ tab on the Left Hand Side – you will see the data is segmented between Desktop and Mobile. The below image shows that 69.77% of users came from Desktop – whereas 30.23% came from Mobile.
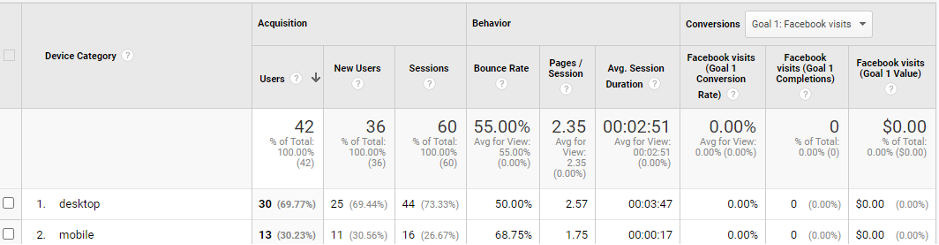
You can also get a broader view of the browsers your customers are using. Using Google Analytics to find what devices or browsers the users are most likely to use is a huge advantage.
Exit Rate or Exit Percentage
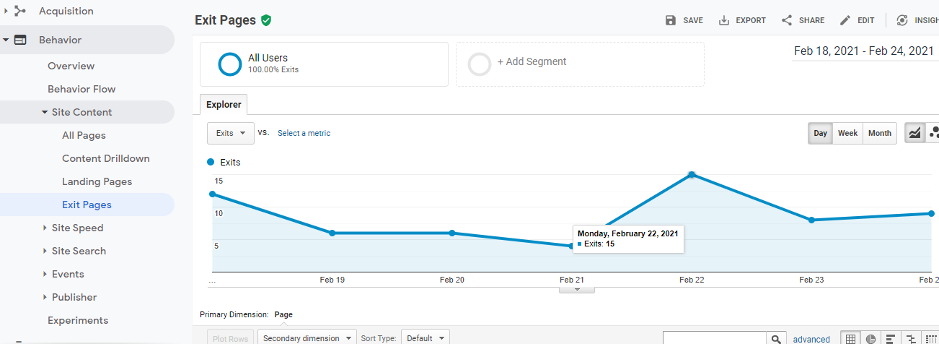
The Exit Rate in Google Analytics refers to the number of times the visitors have left the site from a single page. It helps you understand how often the visitor exits the website after visiting any particular page.
If you need to convert more visitors into buyers or potential customers – you need to know how they navigate your website.
Exit percentage is the pinpoint on your website, where the user leaves before converting. If you have a high exit percentage, you are probably losing customers.
In such a case, you need to closely look at the pages to determine where people are leaving. You can make changes to the content or add appealing images to reduce the exit percentage on any particular page.
